
Chapter 35 · Financial reports · 3 min read
Balance Sheet
On this page
A balance sheet states what a business owns, what it owes and what is left over for its owners, at one particular point in time. Where the profit and loss statement covers a stretch of time, the balance sheet is a snapshot: assets, liabilities and equity as they stood on a given date. In SAABI you can view it on a monthly, quarterly, half-yearly or yearly basis. Open it from the sidebar at Reports > Balance Sheet.
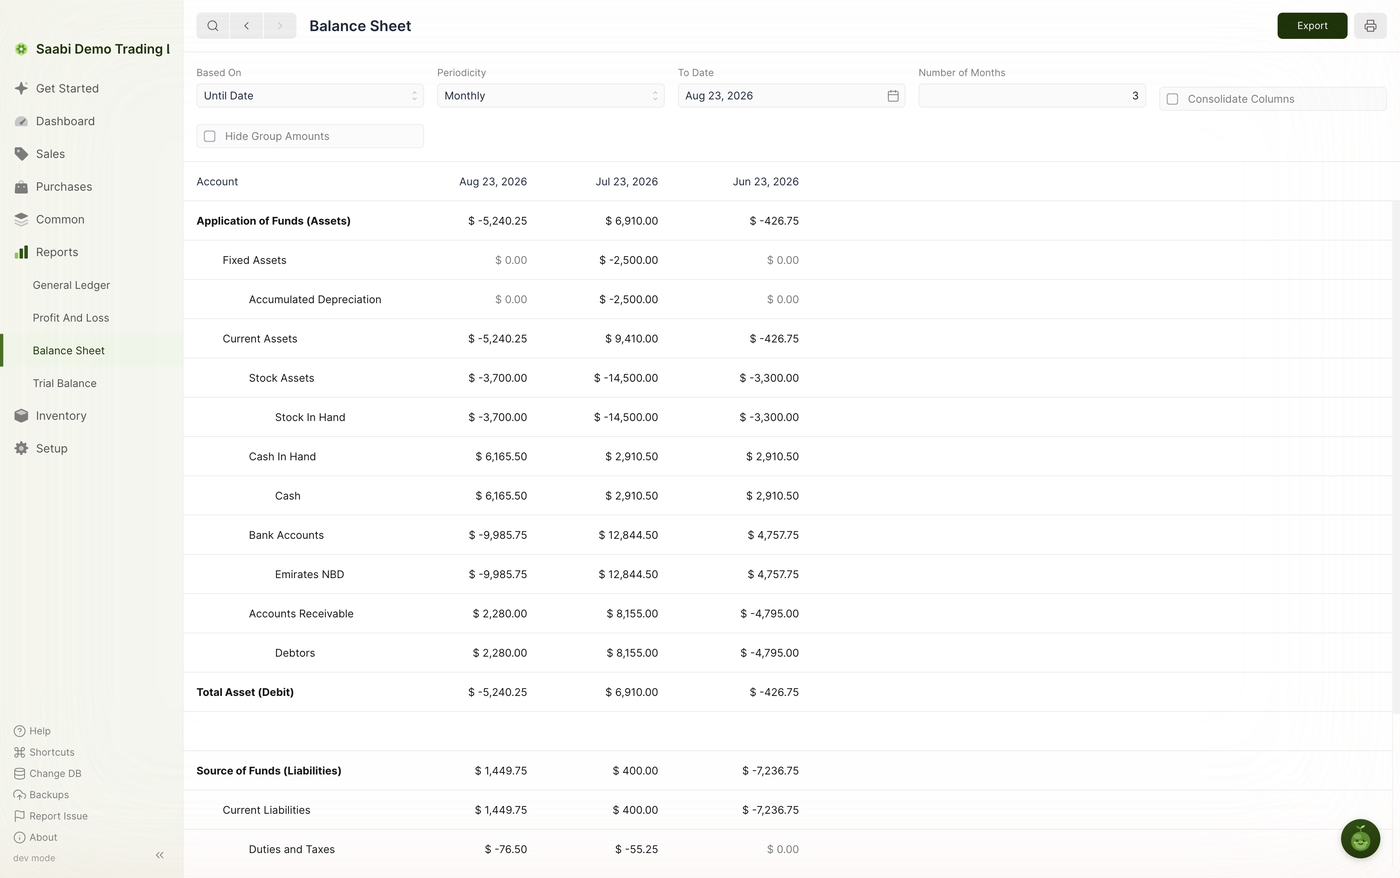
How the report is laid out
The first column names the account. Each remaining column is a date, newest on the left. Every figure in a column is the balance of that account as at that date, not the movement during the period leading up to it.
The body follows the three root groups that make up the accounting equation:
- Application of Funds (Assets) — what the business holds.
Fixed AssetsandCurrent Assetsgroup the ledger accounts beneath them, soBank AccountsholdsEmirates NBD,Cash In HandholdsCash,Accounts ReceivableholdsDebtors, andStock AssetsholdsStock In Hand. The half closes with Total Asset (Debit). - Source of Funds (Liabilities) — what the business owes, grouped as
Current Liabilitiesand the accounts beneath it, such asDuties and TaxesandStock Liabilities, with its own total. - Equity — the owners' claim on what is left.
Note
Assets equal liabilities plus equity. If you are not sure why, see Chapter 9.
A negative figure in an asset row means the account carries a credit balance — a bank account overdrawn, or stock issued out ahead of the receipts that cover it. It is worth investigating rather than ignoring.
Filters
The filter row carries the same four controls as the Profit and Loss report — Based On, Periodicity, Consolidate Columns and Hide Group Amounts — and they work the same way; see Chapter 34 for the full description. The difference is what a column means here: with Periodicity set to Monthly, each column is one month end, and every figure is the balance as at that date.
Date range filters
As on the Profit and Loss report, the date filters depend on Based On: Until Date gives To Date and a count field labelled for the periodicity you chose, and Fiscal Year gives To Year and From Year (Chapter 34). A count of 3 with monthly periodicity gives the three month ends up to To Date.
Hide Group Amounts
The report shows group accounts such as Current Assets alongside the ledger accounts beneath them, such as Cash and Debtors, so the same money is reported twice on screen — once at the group and once at the ledger account. Checking Hide Group Amounts blanks the group figures and leaves only the ledger account amounts, as described in Chapter 34.
Folding rows
Group rows fold and unfold on click, as on the Profit and Loss report (Chapter 34). Fold Current Assets when you want the shape of the balance sheet on one screen, and unfold the one group you need to look into.
Using the report
- Read it at a year end for the statutory position, and at a month end for a quick health check.
- Compare consecutive columns to see what moved: receivables climbing while cash falls means you are invoicing but not collecting.
- Check that stock and receivables are not absorbing more cash than the business can carry.
Tip
The balance sheet tells you the position; the General Ledger tells you how it got there. When a figure surprises you, filter the ledger to that account for the period between the two columns.
Click Export in the top right to save the report as a CSV or JSON file, or use the print icon beside it to print or save a PDF.
Saabi Desktop User Manual 1.0 · covers Desktop 1.0.0 · Something wrong or missing? Tell us