
Chapter 45 · Inventory · 3 min read
Stock Balance
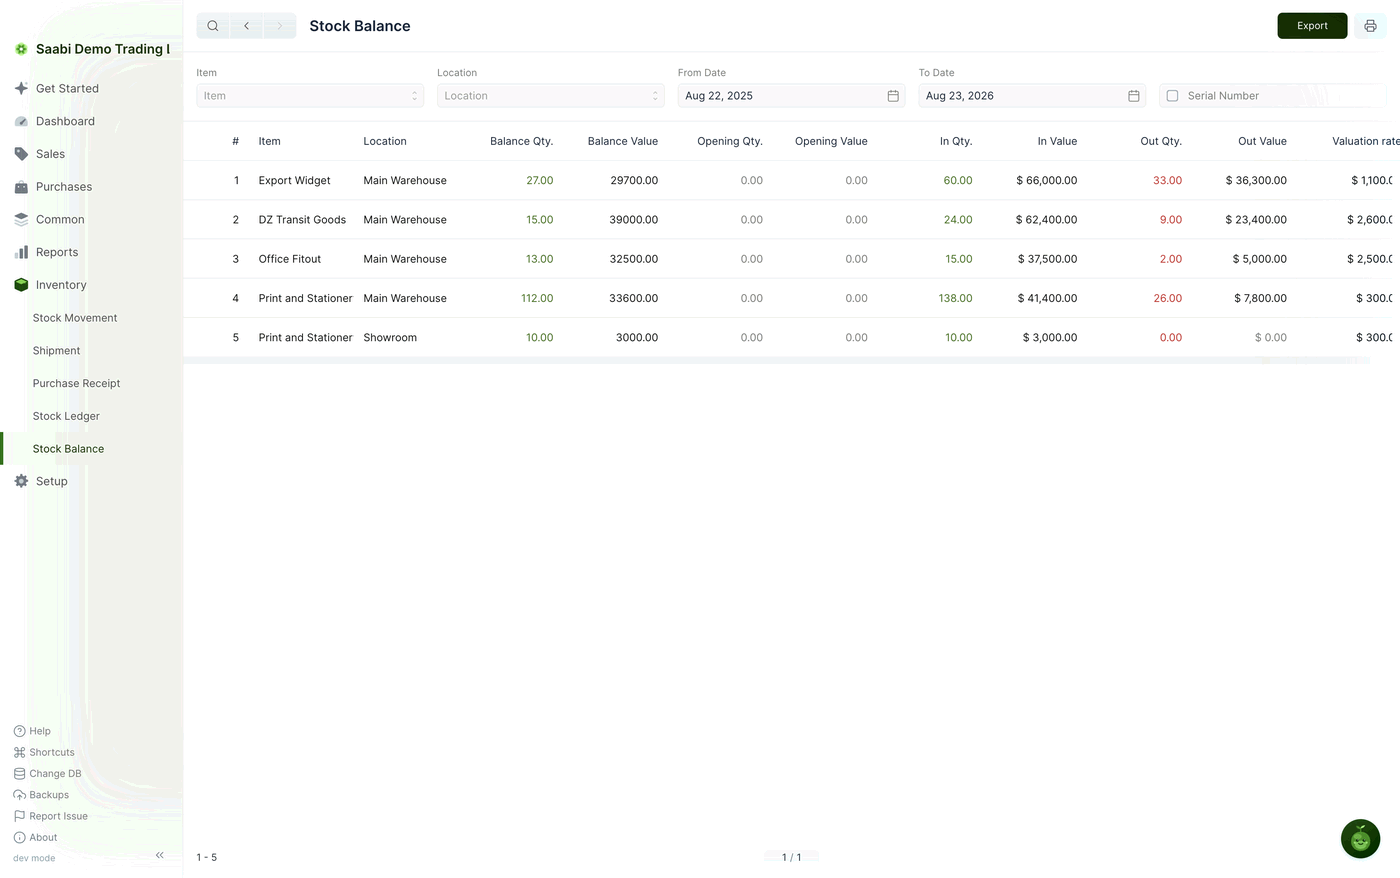
The Stock Balance report answers the question the Stock Ledger makes you work for: how much of each item do I have, where is it, and what is it worth. Where the ledger gives you one line per movement, Stock Balance gives you one line per item and Location, with the opening figures, everything that came in and went out over the period, and the balance left at the end. Check it before you promise a customer a delivery date, and before you record a movement you are not certain a Location can cover.
To open it, go to Inventory > Stock Balance.
Filters
- Item — shows only the item you choose. Leave it empty to see everything you hold.
- Location — shows only the Location you choose. Leave it empty to see every Location, which is how you find out where an item is spread.
- From Date — the date the period starts. Everything that happened before it is rolled up into Opening Qty. and Opening Value rather than being ignored, so the report always balances.
- To Date — the date the period ends. Movements after it are left out of the figures entirely.
- Serial Number — a checkbox that breaks the report down by serial number, for items you have marked as serialised.
Columns
- Item — the tracked item.
- Location — the Location this line reports on. An item held in two places has a line for each.
- Balance Qty. — how many units are at that Location at To Date.
- Balance Value — what those units are worth, in USD.
- Opening Qty. — how many units were there at From Date, before the period began.
- Opening Value — what those opening units were worth.
- In Qty. — total units received at that Location during the period.
- In Value — the value of those receipts.
- Out Qty. — total units that left that Location during the period.
- Out Value — the value of what left.
- Valuation rate — the value SAABI carries per unit.
The table scrolls sideways if the window is too narrow to show every column at once.
Reading a line
The columns tie together, which makes the report straightforward to check. Take the first line of the report shown above: Export Widget at Main Warehouse opened at nothing, took in 60.00 units worth $66,000.00, sent out 33.00 units worth $36,300.00, and is left with a Balance Qty. of 27.00. At a Valuation rate of $1,100.00 a unit, that gives a Balance Value of $29,700.00.
Opening quantity plus what came in, less what went out, equals the balance. If a line does not add up that way, the period you have chosen is cutting through a movement — check From Date and To Date before looking for a fault in the entries.
Tip
If a backdated entry is being refused for insufficient quantity, the cause is often a movement later in the year that the backdated one would leave short. Push To Date forward to cover the rest of the year and read the balance again: a Location that looks healthy today can be over-committed next month.
Taking the report out of SAABI
Export and the print button in the title bar work as they do on the Stock Ledger (Chapter 44): set the filters first, and what is on screen is what is exported. The printed copy is useful as the count sheet for a stock take, with the balance SAABI expects against each item and Location.
Saabi Desktop User Manual 1.0 · covers Desktop 1.0.0 · Something wrong or missing? Tell us