
Chapter 34 · Financial reports · 4 min read
Profit and Loss
On this page
Everything the business has earned since it started, less everything it has spent, is its total profit or loss. That lifetime figure is rarely the interesting one. What you want to know is what happened last month, last quarter or last year — which is why a profit and loss statement is always read for a specific period. The Profit And Loss report gives you income less expenses for a period you choose, broken down by account and split into columns so you can compare one period against the next. Open it from the sidebar at Reports > Profit And Loss.
Use it to:
- Compare this month's profit against last month's.
- Compare quarter against quarter, or year against year.
- Find the total profit or loss for one specific window of time.
How the report is laid out
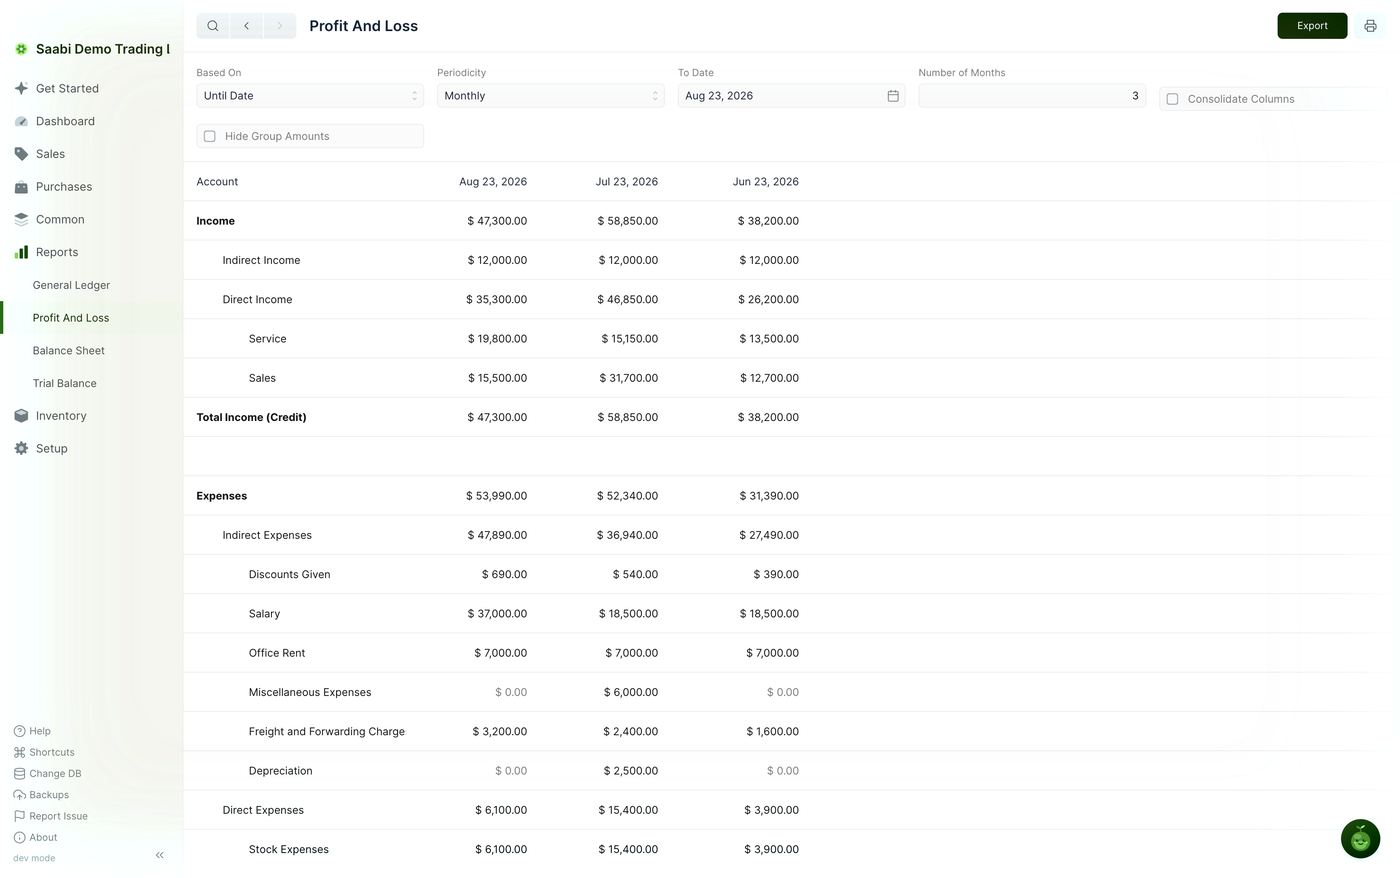
The first column names the account. Each remaining column is one period, newest on the left. By default the report shows the last three months.
The body has two halves. Income comes first, with each income account showing what it earned in each column, and the group accounts above them — Direct Income, Indirect Income — carrying the totals of the accounts beneath. The half closes with Total Income (Credit).
Expenses follows in the same shape, with Direct Expenses and Indirect Expenses grouping the individual expense accounts, and its own total line. The report ends with the profit or loss for each column: total income less total expenses.
Note
At the end of a fiscal year the profit or loss belongs to the owners, so it is carried into equity. The owners' account is a liability to the company, because the company has to pay those profits out.
Filters
- Based On — chooses which kind of date range the report uses. It has two values:
Until DateandFiscal Year. The remaining date filters change depending on which you pick. - Periodicity — the interval each column covers. Set it to
Monthlyand each column is one month. The number of columns follows from the date range. - Consolidate Columns — sums every row across all its columns and shows a single total column instead. Use it when you want the period as one figure rather than a comparison.
- Hide Group Amounts — see below.
Date range filters
The date filters you get depend on Based On:
| Based On | Date range filters |
|---|---|
| Until Date | To Date and a count |
| Fiscal Year | To Year and From Year |
To Date and count. To Date is the last date the report runs to; it defaults to tomorrow's date. The count field sits beside it and is labelled for the periodicity you chose — with Periodicity set to Monthly it reads Number of Months. Set the count to 3 with monthly periodicity and the report shows the three months ending at To Date.
To Year and From Year. These set the fiscal years the report spans. The number of columns depends on Periodicity.
Hide Group Amounts
The report shows group accounts such as Direct Income alongside the ledger accounts beneath them, such as Sales and Service. A group account holds no entries of its own — its balance is the sum of the accounts under it, so every figure on a group row is also counted in the rows below.
Checking Hide Group Amounts blanks those group figures and leaves only the ledger account amounts. The report becomes easier to read, because each amount appears once.
Folding rows
Rows that show group accounts can be clicked to fold everything beneath them out of view. Click the row again to unfold it. Folding Indirect Expenses when you are only interested in direct costs keeps the report to one screen without changing any filter.
Tip
For a compact management summary, set Periodicity to Monthly, check Hide Group Amounts, and fold the halves you are not discussing.
Reading the figures
Income accounts are credit accounts and expense accounts are debit accounts, which is why the totals are labelled (Credit) and (Debit). Amounts shown as $ 0.00 in grey mean the account existed but had no activity in that column.
If a figure looks wrong, open General Ledger, filter by that account and set the same date range. The report gives you the total; the ledger gives you the entries that made it.
Click Export in the top right to save the report as a CSV or JSON file, or use the print icon beside it to print or save a PDF.
Saabi Desktop User Manual 1.0 · covers Desktop 1.0.0 · Something wrong or missing? Tell us