
Chapter 32 · Financial reports · 3 min read
Reports
SAABI has four financial reports, grouped under Reports in the sidebar. Every one of them is built from the same raw material: the ledger entries SAABI writes whenever you submit a transactional entry such as a sales invoice, a payment or a journal entry. Nothing in a report is entered by hand, and nothing you leave in draft appears in one. This chapter covers what the four reports are for and the controls they share; the chapters that follow describe each report in detail.
The four reports
| Report | What it shows | Read it as |
|---|---|---|
| General Ledger | Every individual posting to every account, line by line | A transaction list |
| Profit And Loss | Income less expenses over a period, split by account and by column | A period summary |
| Balance Sheet | Assets, liabilities and equity as they stand at a point in time | A position |
| Trial Balance | Opening, movement and closing debits and credits for every account | A proof |
When to use each
- Use General Ledger when you are looking for a specific entry, checking what a document posted, or reconciling one account against a statement. It is the only report that shows individual transactions, and the only one that can be filtered by party or by document.
- Use Profit And Loss to answer whether the business made money, and where the money came from and went. Compare this month against last month, or this quarter against the same quarter last year.
- Use Balance Sheet to see what the business owns and owes on a given date — for a year-end pack, a loan application, or a check on how much stock and receivables are tying up cash.
- Use Trial Balance to confirm the books are internally consistent before you close a period, and as a single sheet listing every account and its movement.
See Chapter 33 (General Ledger), Chapter 34 (Profit and Loss), Chapter 35 (Balance Sheet) and Chapter 36 (Trial Balance) for the full filter and column reference for each report.
Report layout
Every report page has the same two parts.
- The filter row across the top, holding the filters for that report. The filters differ from report to report, but they always sit here.
- The report body beneath it, which is the generated report.
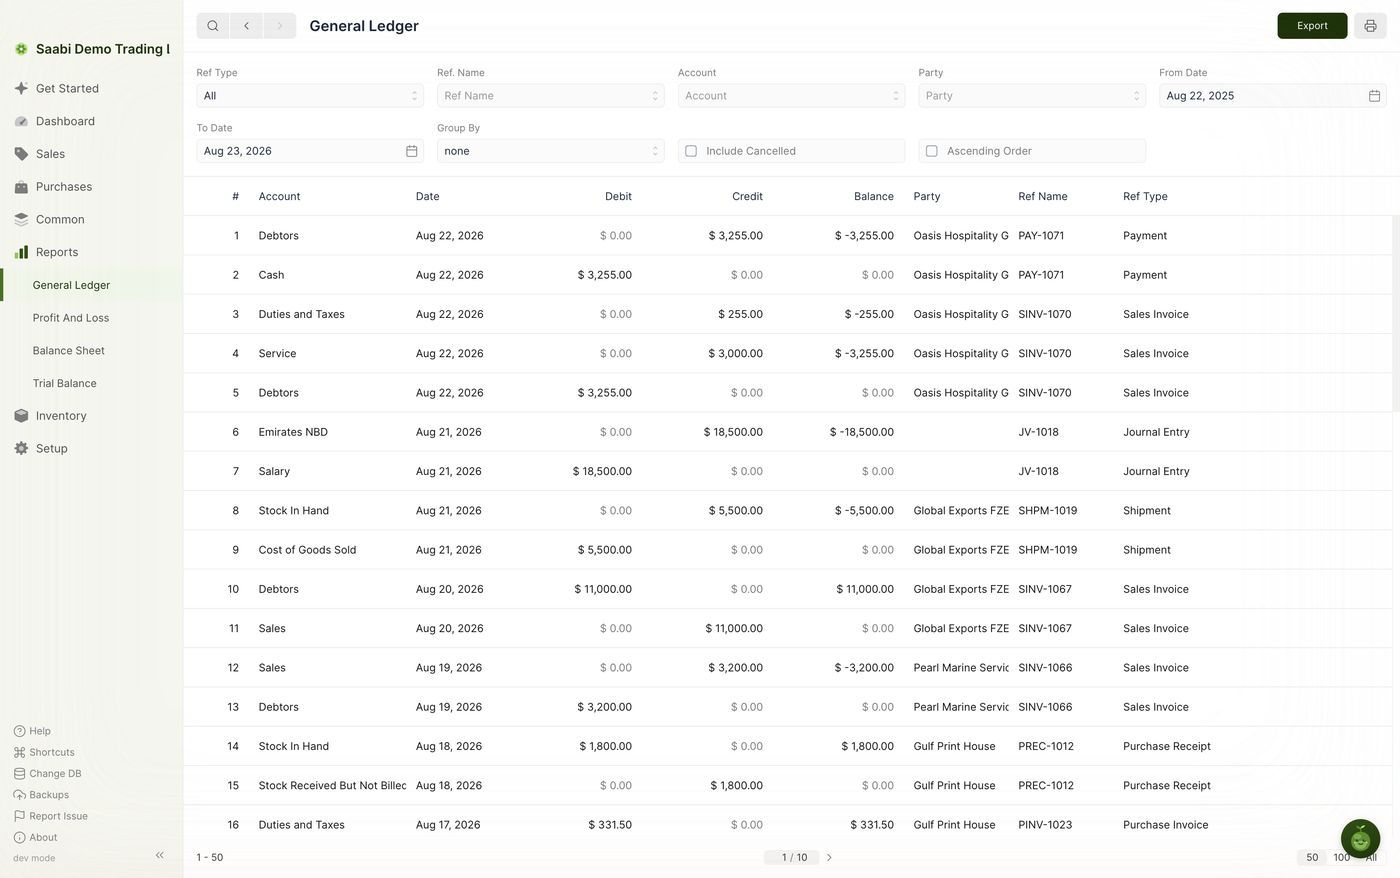
Filters apply as soon as you finish with the filter box. After typing a date or picking a value from a dropdown, click anywhere outside the box and SAABI regenerates the report.
Note
The General Ledger is the only report that can run to more pages than one. Its footer carries a row range, a page control, and a page-size control offering 50, 100 and All.
Exporting a report
Any report can be exported as a CSV or a JSON file.
- Generate the report you want, with the filters set the way you need them.
- Click Export in the top right of the page.
- Choose the file format and the location to save to.
The export contains what is on screen — the same rows and columns the filters produced, not the whole ledger — so set the filters before exporting rather than trimming the file afterwards. A CSV export opens in any spreadsheet application. Use JSON when the figures are going into another system.
Printing a report
The print icon sits to the right of Export. It sends the report as it currently stands to your system print dialog, from which you can print it or save it as a PDF.
Tip
Reports carry no editable state of their own. Changing filters, exporting and printing never alter your books, so you can work through a report freely.
Saabi Desktop User Manual 1.0 · covers Desktop 1.0.0 · Something wrong or missing? Tell us