
Chapter 10 · The basics · 4 min read
Dashboard
On this page
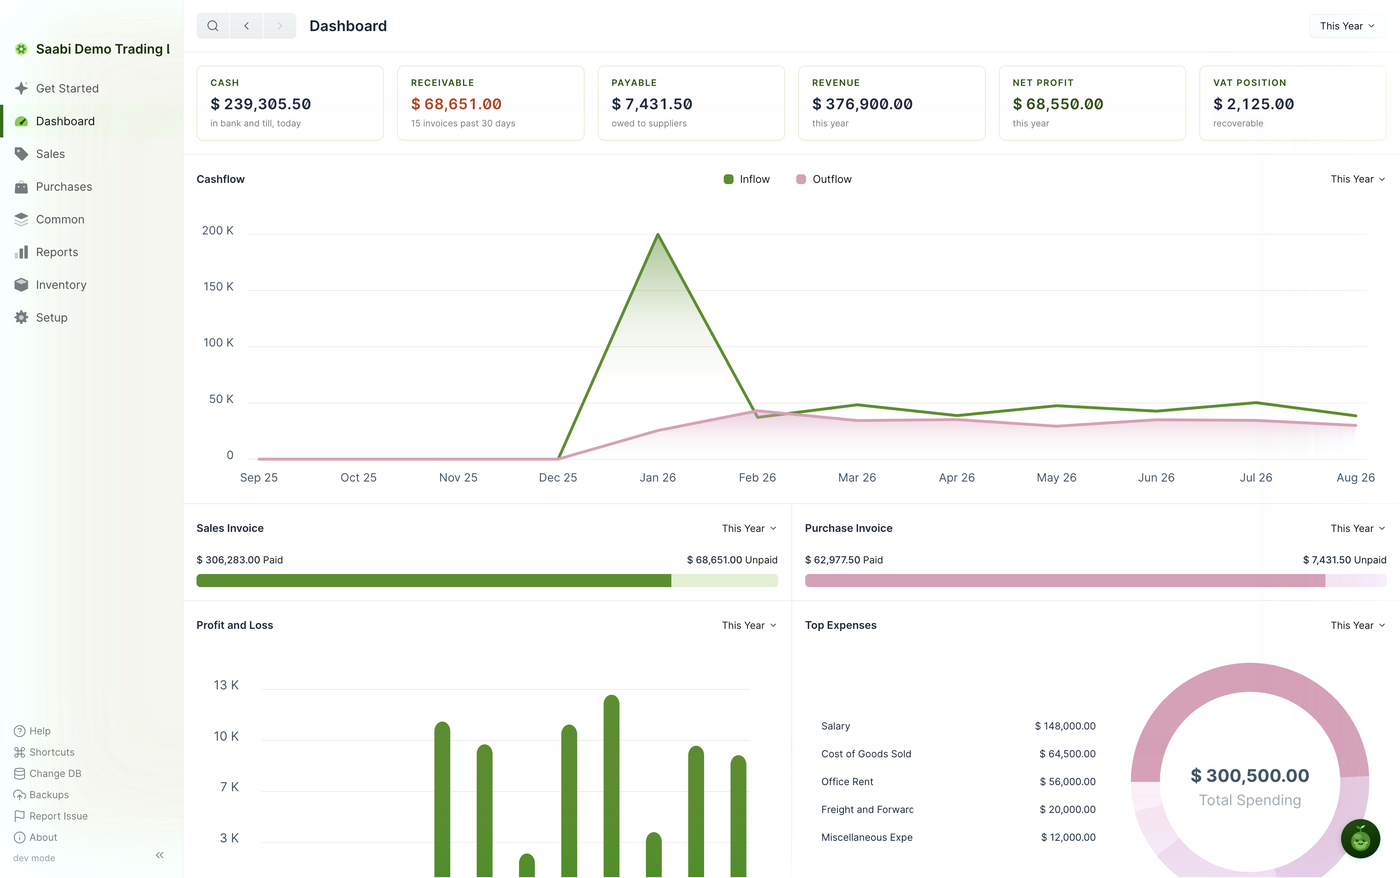
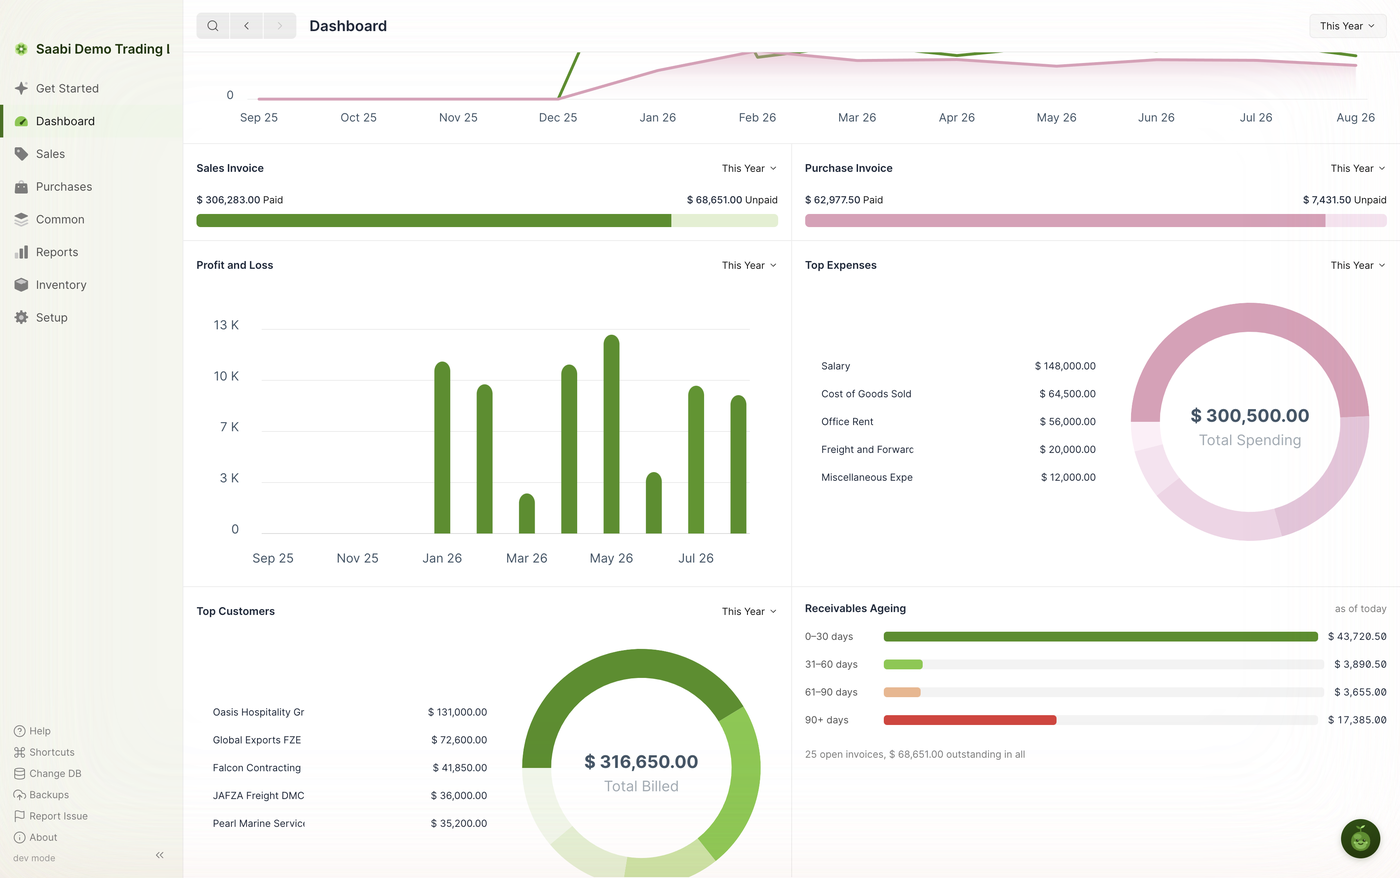
The Dashboard is the overview page of your books: cash and profit at a glance, what customers owe you, what you owe suppliers, where the money went, and how overdue the receivables are. It reads from entries that have been submitted, so it changes as you post invoices and payments. Open it by clicking Dashboard in the sidebar.
The period selector
Every widget carries its own period selector in its top right corner, and the page header carries one as well. The default everywhere is This Year. There are three options, each measured back from today rather than from the start of a calendar period. Taking today as Aug 22, 2026:
| # | Option | From | Until (today) |
|---|---|---|---|
| 1 | This Year | Aug 22, 2025 | Aug 22, 2026 |
| 2 | This Quarter | May 22, 2026 | Aug 22, 2026 |
| 3 | This Month | Jul 22, 2026 | Aug 22, 2026 |
Note
Cashflow and Profit and Loss do not offer This Month; both plot one point per month and need a longer span to be readable. Receivables Ageing has no period selector at all — it is always measured as of today.
The KPI strip
Six tiles run across the top of the page. Each shows one figure with a line of context beneath it.
- Cash — what you hold in bank and till, today.
- Receivable — the total your customers still owe, with the number of invoices behind it over the past 30 days. It is shown in red as a reminder that the money is not yours yet.
- Payable — the total owed to your suppliers on unpaid purchase invoices.
- Revenue — income recognised this year.
- Net Profit — income less expenses this year.
- VAT Position — the tax you would recover or pay if you filed today. The line beneath the figure reads
recoverableorpayabledepending on which way the balance falls.

Cashflow
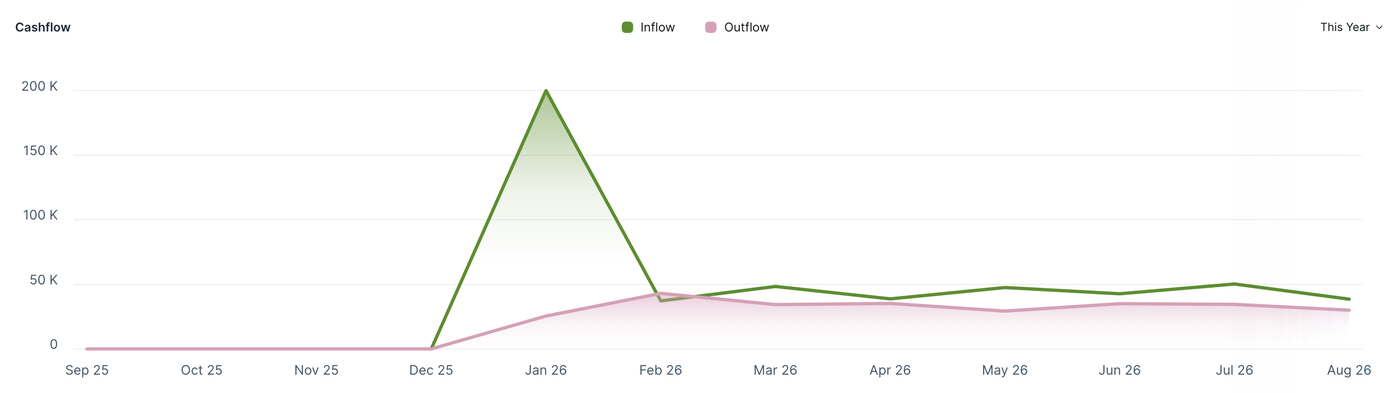
Cashflow plots money moving into and out of the business, one point per month, as two shaded areas: Inflow in green and Outflow in pink. It is calculated from your cash and bank account balances, so it shows money actually received and paid, not invoiced. Hover over any month to read the inflow and outflow figures for it.
Sales Invoice and Purchase Invoice
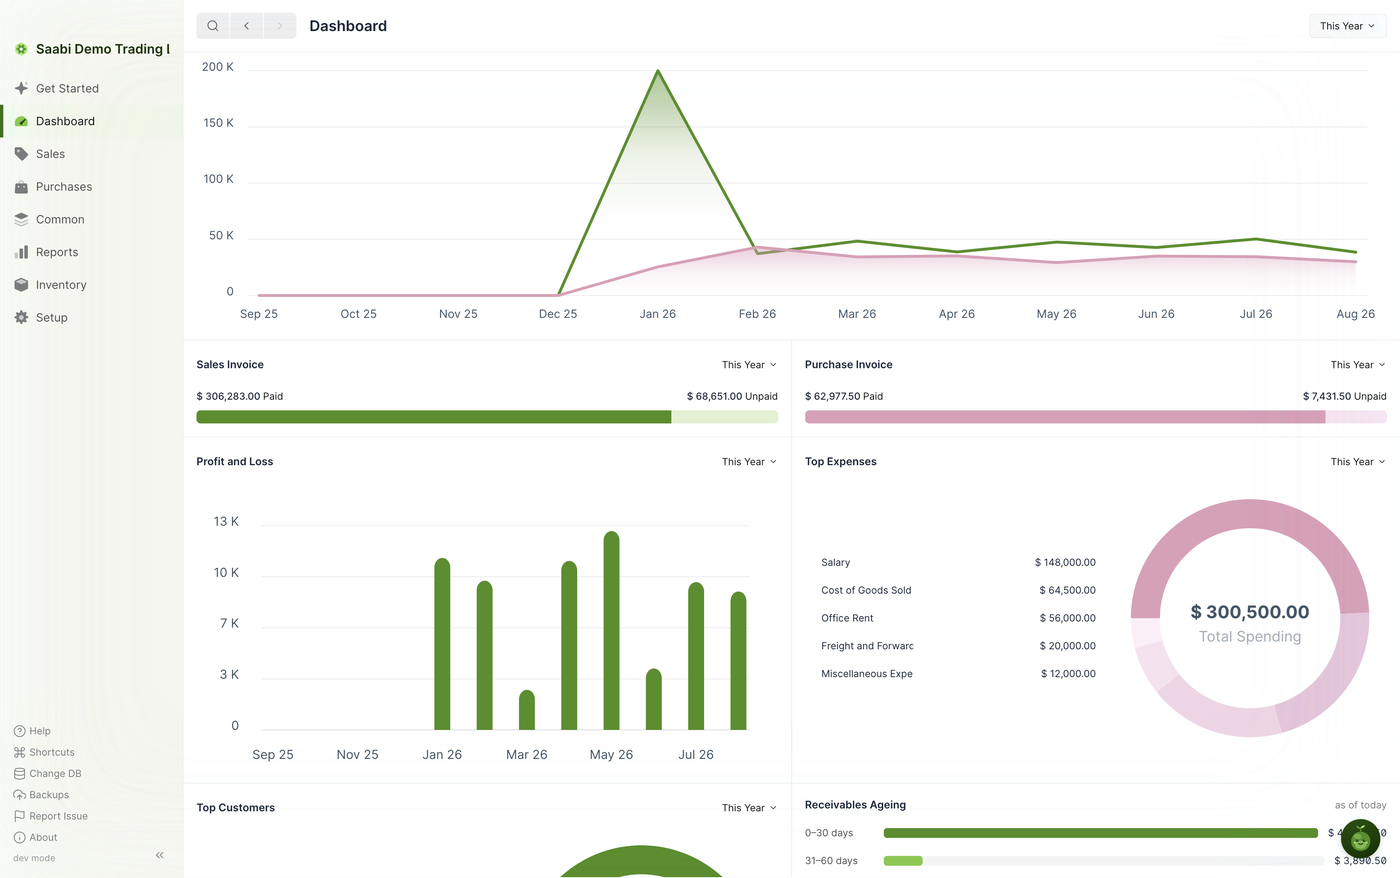
Below the chart sit two bars showing how much of your invoiced value has been settled.
- Sales Invoice shows the amount your customers have paid against the amount still outstanding —
$306,283.00 Paidand$68,651.00 Unpaidin the demo file. The filled part of the bar is the paid share. - Purchase Invoice does the same for money you owe suppliers.
Hover over either bar to see how many invoices make up the paid and unpaid halves. A long unpaid tail on the sales bar is the cue to open Sales > Sales Invoices and chase the outstanding entries.
Profit and Loss
Profit and Loss charts the profit or loss for each month in the selected period as a bar. Profit is the difference between your income and expense accounts for that month. Months with no activity show no bar. Hover over a bar to read the amount. For the account-by-account detail behind these bars, use the Profit and Loss report.
Top Expenses
Top Expenses ranks your five largest expense categories from highest to lowest, listing each with its amount, and shows them as a donut. The centre of the donut carries Total Spending for the period. The figures come from your expense account balances, so the categories are your own expense accounts — Salary, Cost of Goods Sold, Office Rent and the rest.
Top Customers
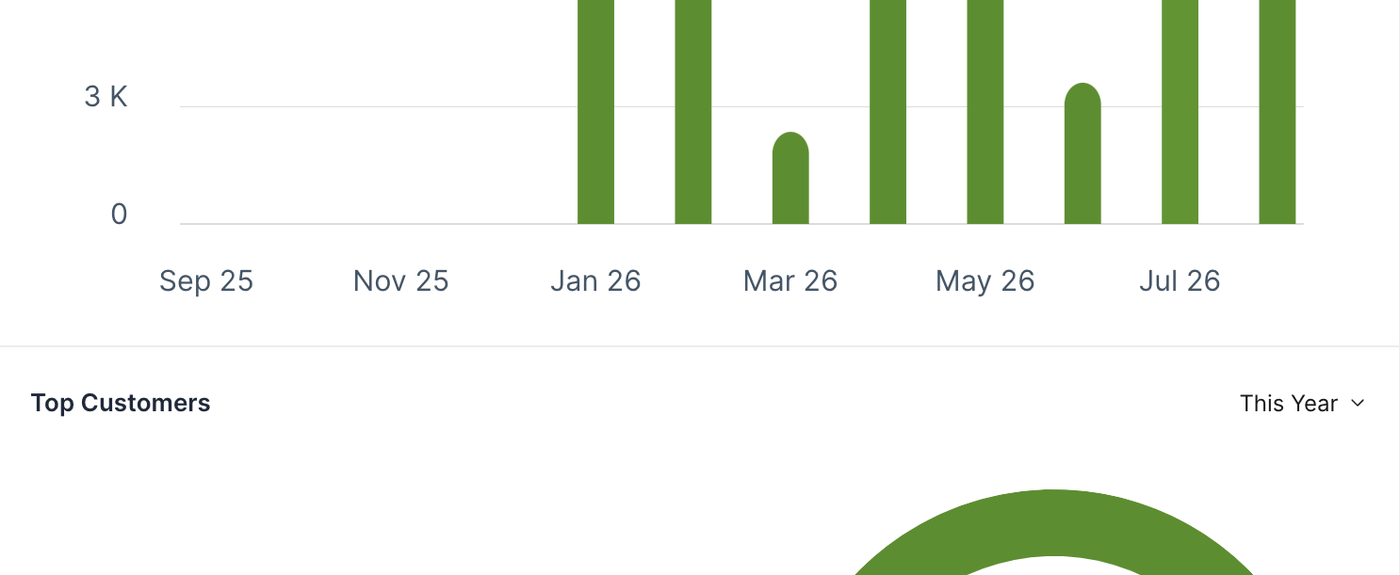
Top Customers does the same for revenue: your five largest customers by value billed in the period, listed with their amounts, with Total Billed in the centre of the donut. Use it to see how much of your revenue depends on a small number of accounts.
Receivables Ageing
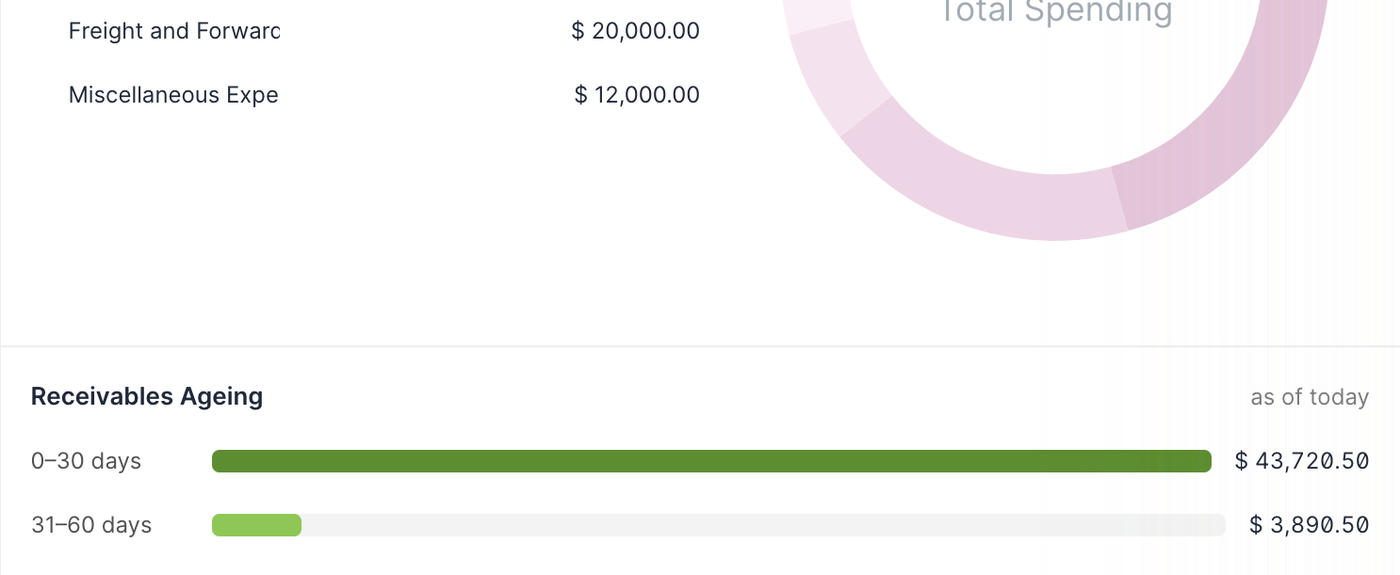
Receivables Ageing breaks your outstanding receivables into four buckets by how long they have been outstanding, and draws each as a bar with its amount alongside.
- 0–30 days — current, within normal terms.
- 31–60 days — slipping.
- 61–90 days — worth a call.
- 90+ days — seriously overdue, and the bar is drawn in red.
Beneath the buckets is a summary line reading the number of open invoices and the total outstanding across all of them, such as 25 open invoices, $68,651.00 outstanding in all. That total matches the Receivable tile in the KPI strip.
Tip
The shape of this widget matters more than any single figure. Weight in the 0–30 bucket is healthy. Weight in the 90+ bucket means cash you have earned but are unlikely to collect without chasing it.
Note
Every widget reads only from submitted entries. A draft invoice does not appear in any of these figures until you submit it.
Saabi Desktop User Manual 1.0 · covers Desktop 1.0.0 · Something wrong or missing? Tell us